精华好帖回顾 | |
|---|---|
·  卡宴提车照及试驾体验 (2013-12-7) daniello 卡宴提车照及试驾体验 (2013-12-7) daniello | · 童言趣语 (加了PP噢) (2008-5-19) 旋木 |
| · == 悉尼三日,逛吃逛吃== (2017-11-16) 胡须康 | · Darwin Kakadu的旅行 【参加活动】 (2011-4-30) doublezz |
Advertisement
Advertisement |
|
1951| 0
|
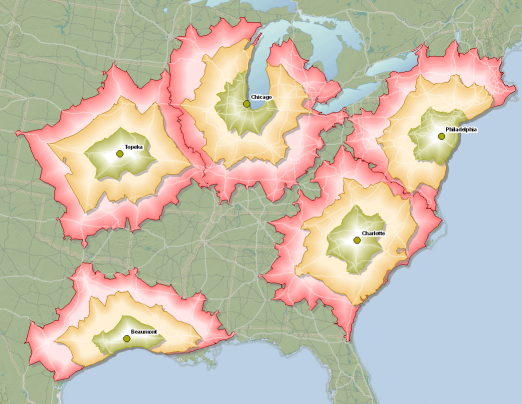
[全澳] MapInfo 有没有和ArcGIS Network Analyst类似的功能? |


 发表于 2015-1-22 11:15